As increased competition and consolidation challenge the financial industry, your business must continue to adapt using strategies for success, not unlike those of other businesses.
Manufacturing and retail have long used product management techniques to meet competitive pressures for pricing, product planning, and growth strategies. If financial institutions are to survive and prosper in this highly charged competitive environment, management must understand and control all components of profitability. Margin and equity risks have been addressed using regulatory rate shock methodologies, as well as recommended and required stress testing of the loan portfolio, including loan losses. Product profitability combines these concepts with an often-overlooked element of cost – overhead.
Before beginning a budget, finalizing any financial plan, or setting in motion any actions for execution, it is imperative that management knows their cost structure. Armed with this knowledge, the team will be able to identify opportunities, avoid diminishing margins, and provide services in the most efficient way.
With this, then, we advocate using a simple and effective Product Profitability analysis. The necessary detail is easy to obtain and manage within your existing planning processes. To begin, you must assign an overhead cost factor to all interest-bearing product lines. This percentage represents the basis point adjustment deducted from an account’s gross yield. You may use either internal or external data for this measure.
Next, determine if there are there other factors affecting your product line’s interest rate that should be noted. For example, costs associated with Loan Losses or Fees that are associated with this product line, but are recorded separately on your income statement.
The last – but very important – factor remaining is the product line’s repricing frequency. As with all other risk analyses, repricing frequency is key to risk management and match funding analysis. By sorting asset balances by repricing frequency, your baseline is now complete. With these details in hand, you will be ready to build a platform for your analysis. Let’s review.
• Repricing frequency
• Current EOM Balance
• Current Yield (FTE)
• Net Overhead Adjustment
• Losses/Fees
Repeat the same for interest-bearing liabilities.
With this simple-yet-analytically-rich information, you can next build an effective analytical report. Here, there are two methods for presenting the data: Match Funding or Funds Pooling.
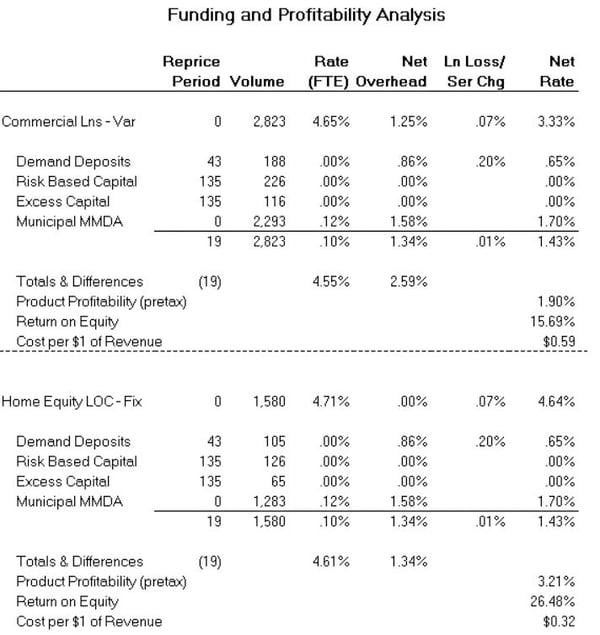
The example below illustrates the Match Funding method. This analysis sorts first by repricing frequency of the interest-bearing asset. It then funds the asset with liabilities, also sorted by repricing frequency. 
This matching approach groups volumes and rates by the inherent repricing risk embedded in your product line. As part of the liability funding, we’ve also distributed an allocation of Capital, both Risk-Based and Excess Capital, to each asset in the analysis.
A waterfall report is then created, as the liabilities “fill up” the asset category until their volumes are matched, then any remaining balances flow into the next asset category. As the balances are matched, the rates are displayed and adjusted for overhead. Loan yields are further adjusted for Loan Fees, and reduced for anticipated Loan Losses. Liabilities are credited with service charges when applicable and the Net Rate is displayed.
The importance of this approach is to identify each asset’s True Rate and True Cost of funding that activity. This method can bring real insight into the true performance of your product line.
It is not uncommon at this juncture for many to argue with the allocations. If that becomes the case within your financial institution, then we suggest a Funds Pool approach.
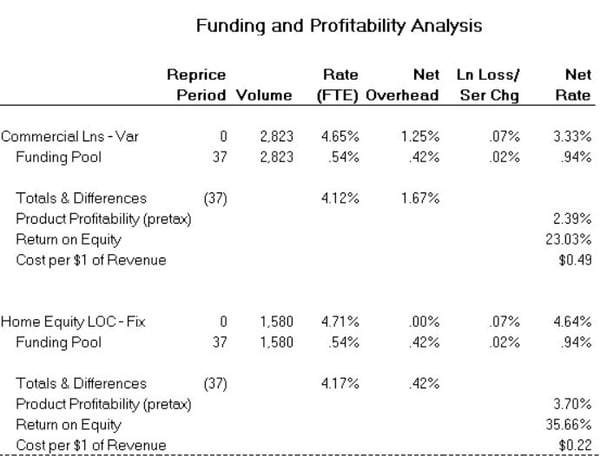
Funds Pooling uses the same analytical methodology; however, it consolidates the funding liabilities into a pool. The pool remains consistent for all interest-bearing assets, eliminating arguments about liability allocation.
In either case, the end results are significantly informative to the financial institution, including your management team, Board of Directors, and Examiners. What is the TRUE rate for the asset product category? What is its Return on Equity, and what is its cost per $1 of revenue? These are important insights that should be examined regularly, especially during times of economic shifts such as rising interest rates and inflation.
How to Use This Information: There are three specific uses for product profitability information: to develop product strategies for your marketplace; to improve the pricing of service lines to make them more profitable; and, to ensure profitable increased growth.
- Product Strategy is based on margin, overhead risk, market characteristics, and community benefit. Using this information in conjunction with the other factors leads to the most effective product mix for your market.
- Product Pricing should be significantly influenced by both cost and opportunity. By approaching the pricing from the cost side first, and then comparing the results with the price currently available in the market, the product manager can make the decision to look to cost reduction, market an alternative product or service, or possibly eliminate the product or service altogether.
- Profitable Growth Strategies can be developed by choosing the appropriate product mix, intelligent marketing programs to promote the bank’s most profitable services, and working to increase asset income while simultaneously offering more aggressive deposit pricing to attract deposits from competitors.
In summary, for your next budget meeting, we encourage you to go beyond a simple review of interest rates. Dig a bit deeper and examine your institution’s true rates using product profitability analytics. You’ve got nothing to lose but basis points.
 Sue West
President
